


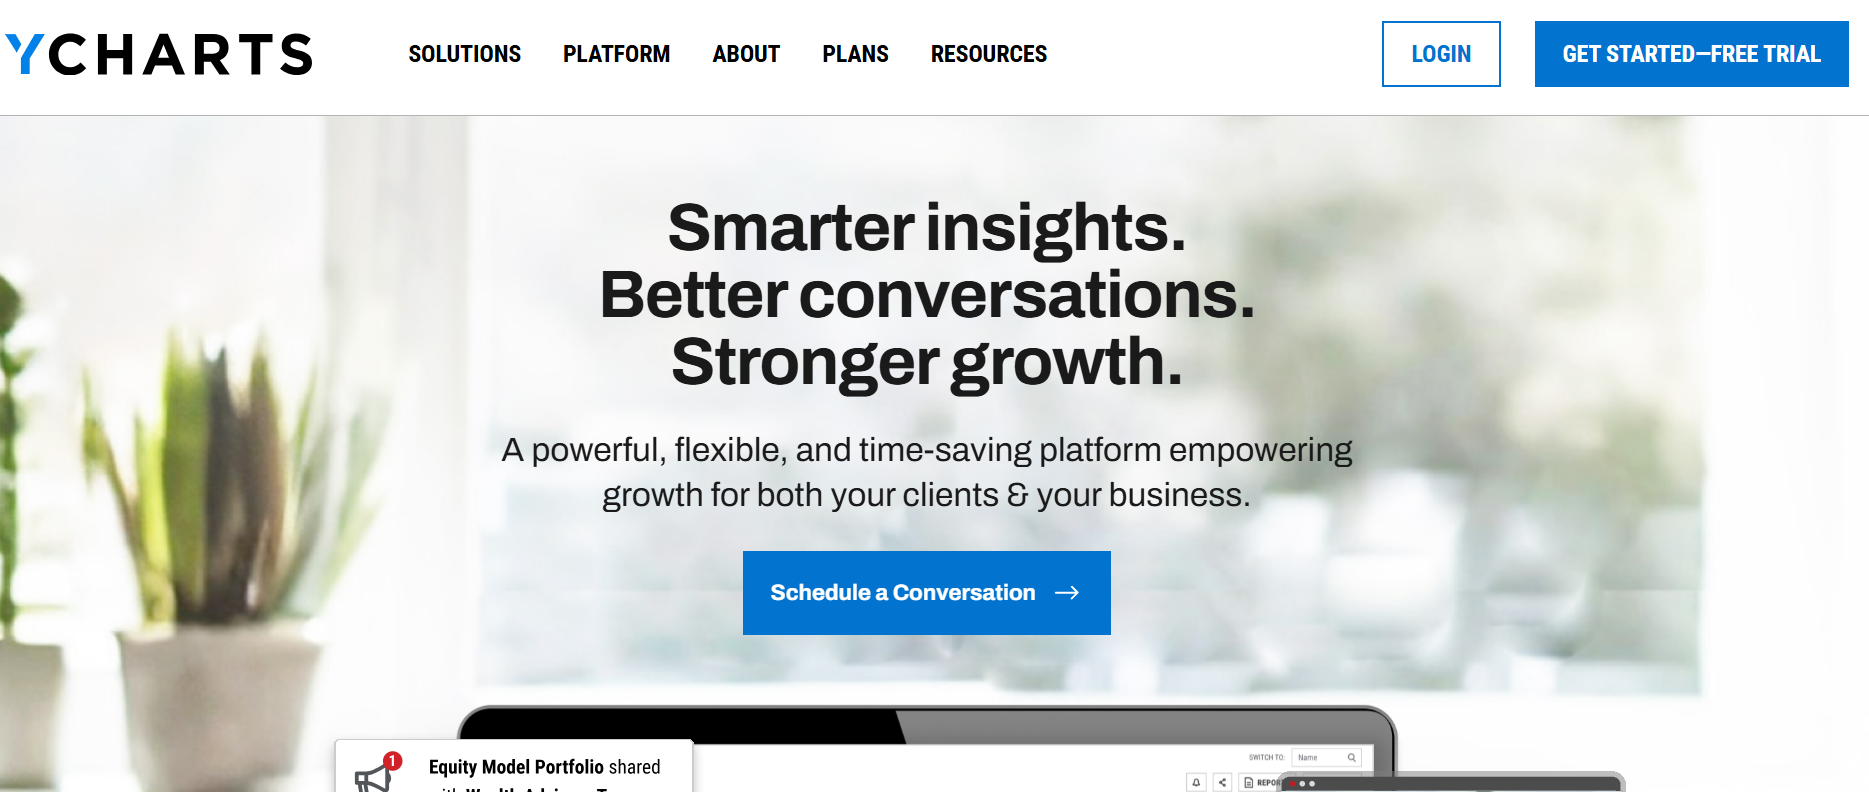
YCharts is a powerful financial research and client communication platform that transforms complex data into actionable insights for financial advisors, asset managers, and investors. With intuitive tools for portfolio analysis, proposal creation, and market monitoring, YCharts helps professionals save time, strengthen client relationships, and drive business growth.
Key Features:
-
Custom Proposals & Reports: Create branded client materials that simplify complex financial concepts
-
Portfolio Analytics: Compare holdings, test scenarios, and optimize asset allocations
-
Fundamental Charting: Visualize financial data with 750+ metrics and ratios
-
Market Dashboards: Monitor key positions, economic indicators, and research lists
-
Model Portfolios: Build, analyze, and share investment strategies
-
Economic Calendar: Track important market-moving events
-
SEC filings analysis: Quickly extract insights from company reports
Best for:
-
Financial Advisors looking to enhance client communications and grow AUM
-
Wealth Management Firms needing efficient research and reporting tools
-
Asset Managers seeking to empower their sales teams with better analytics
-
RIAs requiring compliant, branded client materials
-
Investment Committees making data-driven portfolio decisions
-
Finance Educators teaching real-world investment analysis
-
Self-Directed Investors wanting institutional-grade research tools
Pricing: Free 7-day trial available. Paid plans start at $249/month for professionals. Enterprise pricing available for firms.
Disclaimer: Please refer to the website for the most accurate and current pricing details and service offerings.
Try nowPromote YCharts

Write a review
 Own or work here?
Claim Now!
Claim Now!
Own or work here?
Claim Now!
Claim Now!

-
$99.00
/ Per Listing
-
Duration : Unlimited days
Lorem ipsum dolor sit amet, lorem sit.
- Verified check mark
- Indexed on Google
- FAQ Section
- Tags or keywords
- Free newsletter feature
- Published within 2 days
- Long texts and media
- Social Links
- Lead Form
- Announcement Feature
- Deals/Offers/Discounts Feature
-
$49.00
/ Per Listing
-
Duration : Unlimited days
Lorem ipsum dolor sit amet, lorem sit.
- Verified check mark
- Indexed on Google
- FAQ Section
- Tags or Keywords
- Free newsletter feature
- Published within 4 days
Claim request is processed after verification..
Featured AI Tools
-
-
Oracle Financial Reporting Compliance Cloud
Oracle Financial Reporting Compliance is a powerful module within Oracle…
-
AuditBoard
RegComply by AuditBoard is a powerful regulatory compliance management solution…
-
-
Mortgage Automator
Mortgage Automator offers a comprehensive solution for private lending businesses,…

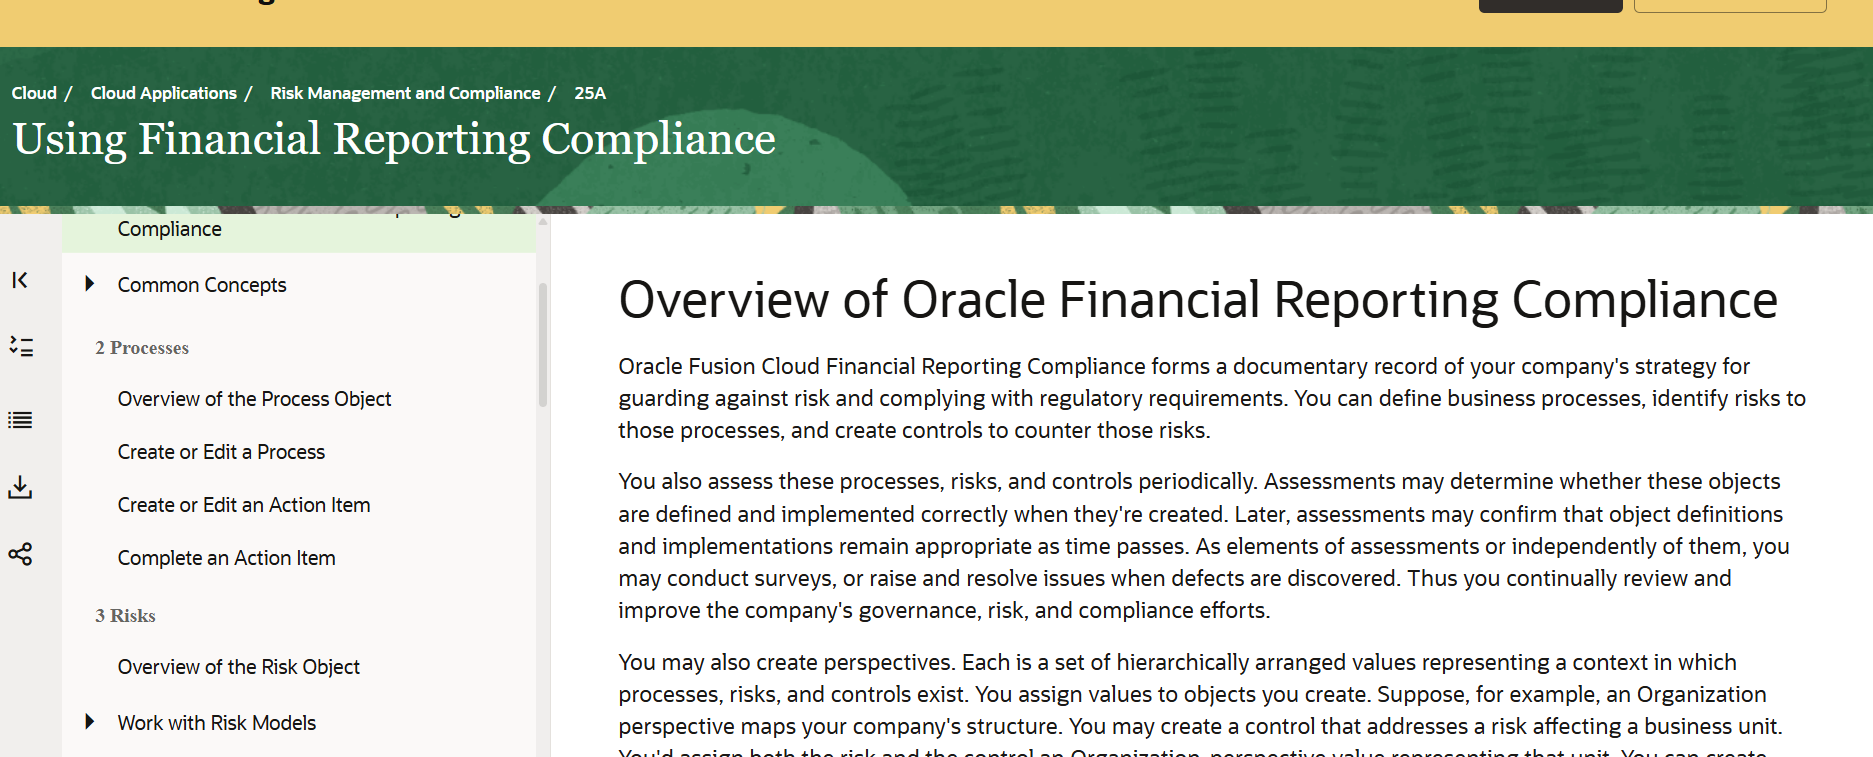
Oracle Financial Reporting Compliance Cloud
Oracle Financial Reporting Compliance is a powerful module within Oracle…
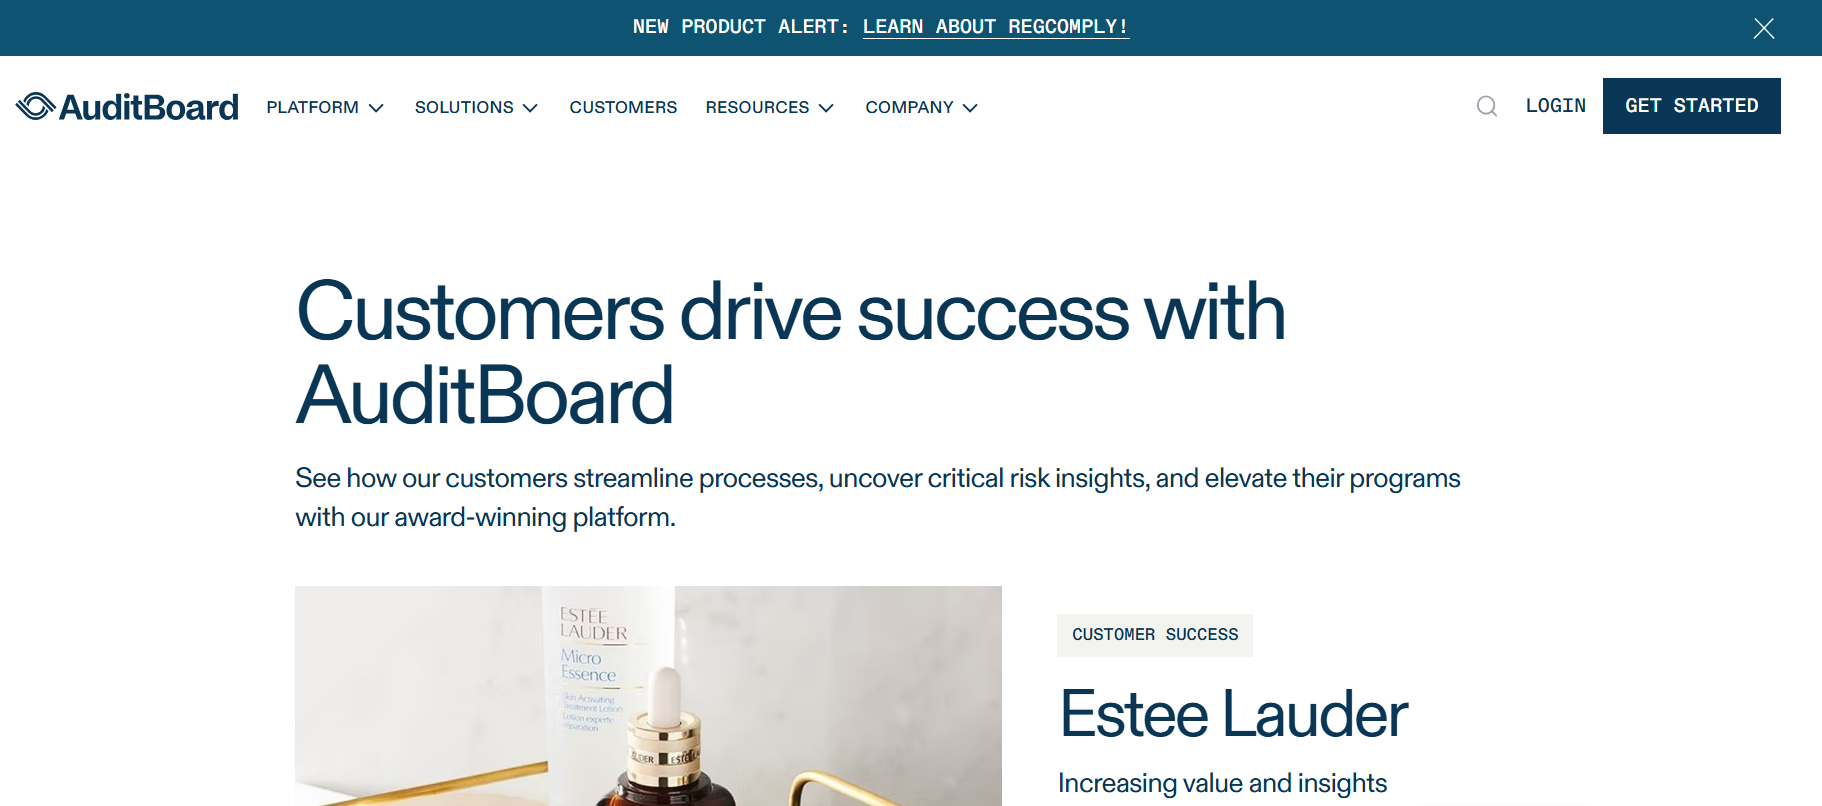
AuditBoard
RegComply by AuditBoard is a powerful regulatory compliance management solution…

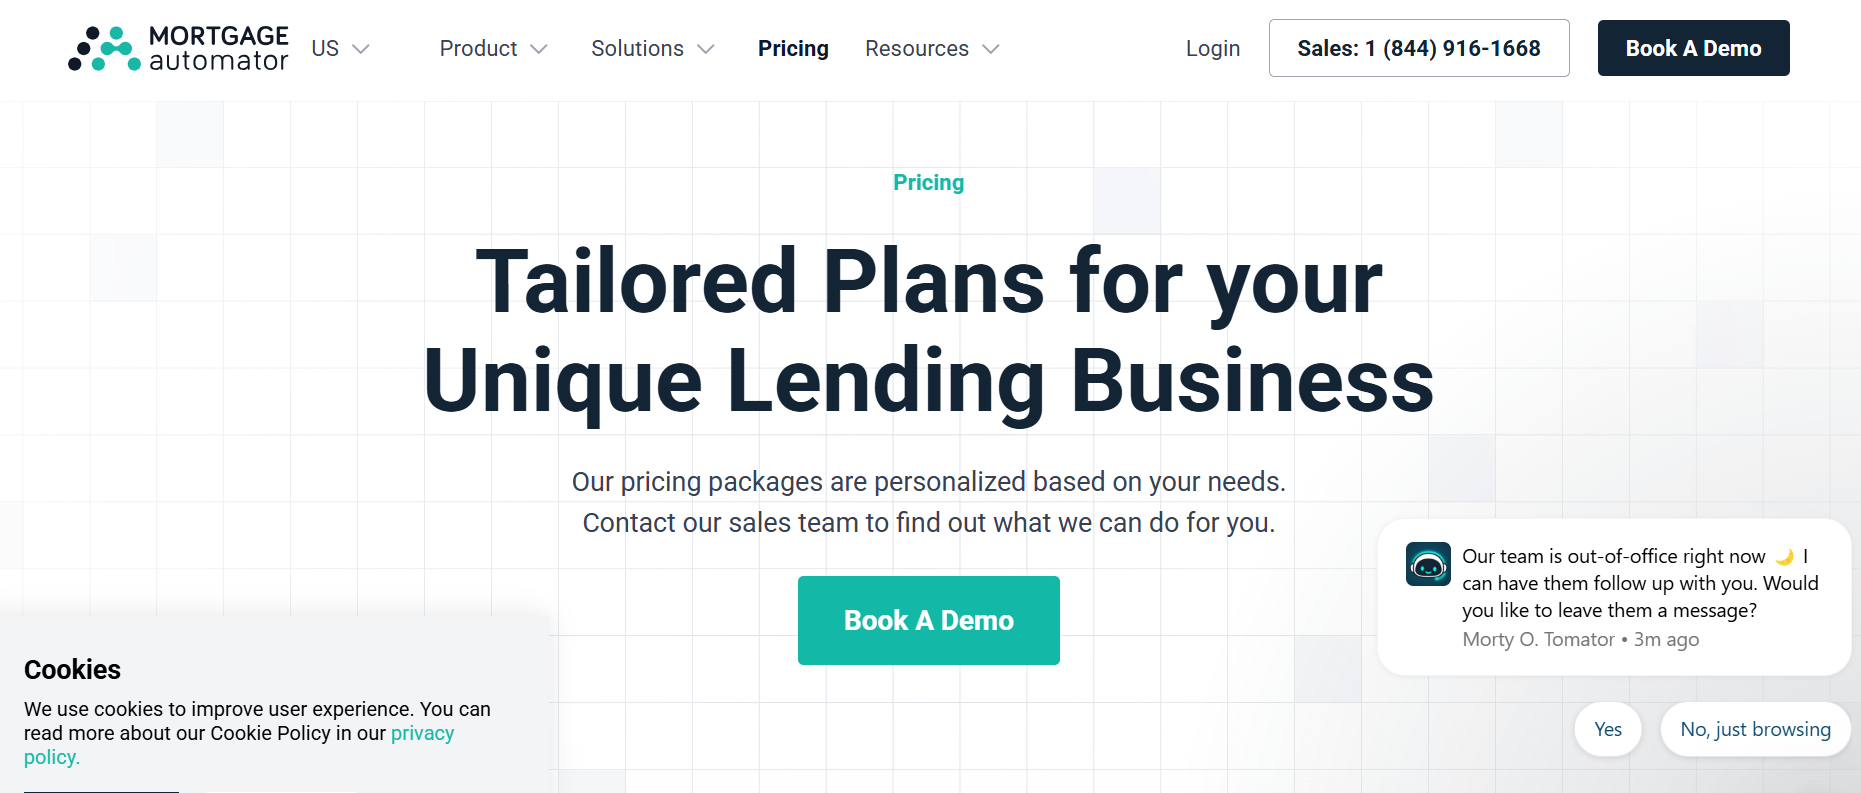
Mortgage Automator
Mortgage Automator offers a comprehensive solution for private lending businesses,…
