


How To Use Gantt Charts Effectively: Plan, Track, and Deliver on Time
- ClickUp
- October 22, 2025
- No Comments
Understanding how to use Gantt charts effectively is fundamental for project managers and teams aiming to streamline workflow, enhance visibility, and ensure successful project completion. Gantt charts serve as visual blueprints of a project timeline, illustrating task sequences, durations, dependencies, and milestones.
Mastering their effective use transforms these charts from simple schedules into powerful project management tools for strategic planning, resource management, and communication. By leveraging Gantt charts properly, organizations can reduce delays, optimize resource allocation, and foster collaboration—ultimately turning complex projects into achievable milestones.
This comprehensive guide explores the critical components of using Gantt charts effectively, from choosing suitable software to advanced techniques like critical path analysis. Whether new to project management or seeking to refine existing processes, understanding these principles can revolutionize how your project teams plan, execute, and deliver results with confidence and clarity.
Understanding Gantt Charts: A Comprehensive Introduction
Gantt charts, developed in the early 20th century by Henry L. Gantt, are graphical representations that display project schedules over time. They visually break down complex projects into individual tasks, showing their start and end dates, durations, and overlaps. Mastering how to use Gantt charts effectively begins with understanding their core purpose: to provide clarity and a visual overview of project timelines, making it easier to identify potential delays or bottlenecks.
Beyond mere deadlines, Gantt charts allow project teams to see task relationships and dependencies at a glance. They serve as living documents that evolve through the project lifecycle. When used effectively, they foster transparency among stakeholders, improve time management, and support decision-making. The key lies in understanding that a well-structured Gantt chart is more than a schedule; it is a dynamic management tool that guides project execution and control with precision and insight.
Choosing the Right Gantt Chart Software for Your Needs
Selecting appropriate Gantt chart software is critical to maximize their potential in project management. There are many options available, ranging from simple spreadsheet templates to sophisticated platforms like MS Project, Smartsheet, or Asana. When considering choices, evaluate features such as ease of use, flexibility, integration capabilities, real-time collaboration, and reporting functions. The goal is to find a tool that aligns with your team’s size, complexity of projects, and specific workflow requirements.
The right software not only simplifies the creation of Gantt charts but also enhances how to use Gantt charts effectively by enabling real-time updates, automating dependencies, and providing analytics. Investing in user-friendly and scalable tools fosters better adoption among team members, encourages ongoing engagement, and ensures that your Gantt charts remain relevant and actionable throughout the project lifecycle. Bearing in mind that the best software adapts to your processes, not the other way around, helps set a foundation for productive project management.
Defining Project Scope and Milestones for Gantt Chart Integration
A clear project scope forms the foundation for constructing an effective Gantt chart. Defining what is included and excluded sets realistic boundaries and helps prevent scope creep. This clarity allows you to break down overarching goals into manageable tasks, which can then be mapped onto your Gantt chart with appropriate timelines. Moreover, setting specific project milestones—point-in-time achievements that mark key phases or deliverables—provides critical checkpoints that keep projects on track and serve as motivational targets.
Integrating scope and milestones directly into your Gantt chart ensures that all stakeholders share a common understanding of project objectives and deadlines. Well-defined scope and milestones also make it easier to assign responsibilities, estimate durations, and visualize dependencies. When these are thoughtfully incorporated into your Gantt chart, your team gains a strategic roadmap that guides daily work while maintaining alignment with overarching project goals, thereby exemplifying how to use Gantt charts effectively to support project clarity and focus.
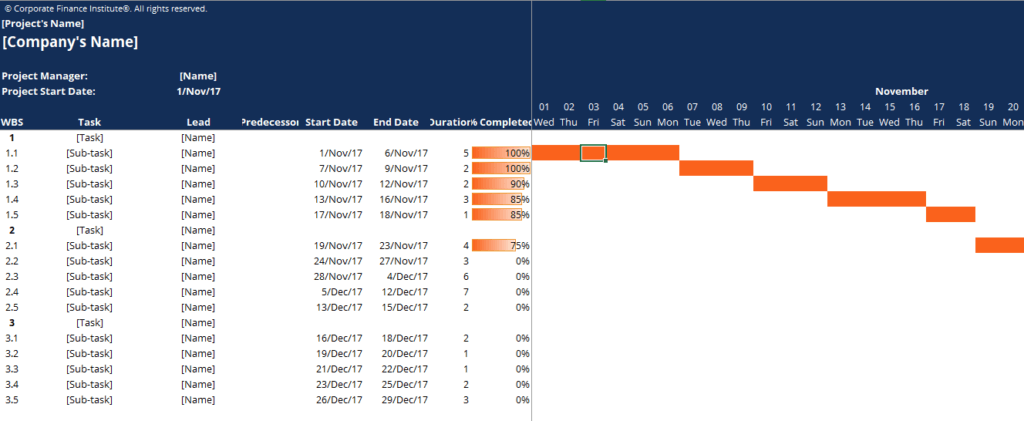
Creating a Realistic Timeline: Estimating Task Durations Accurately
A foundational step in utilizing Gantt charts effectively is creating realistic timelines by accurately estimating task durations. Over-optimistic estimates may lead to missed deadlines and stressed teams, whereas overly conservative timings can result in underutilized resources and unnecessary delays. To strike a balance, it’s vital to gather input from experienced team members, review historical data from similar projects, and consider potential risks or dependencies that could affect task durations.
Accurate estimates form the backbone of a credible Gantt chart, directly influencing resource allocation, scheduling, and stakeholder expectations. Emphasizing transparency and robust communication during estimation fosters trust and accountability. When your timeline reflects true work effort, your Gantt chart becomes a reliable planning tool that enables proactive adjustments, contingency planning, and informed decision-making—embodying how to use Gantt charts effectively for precise project control and delivery assurance.
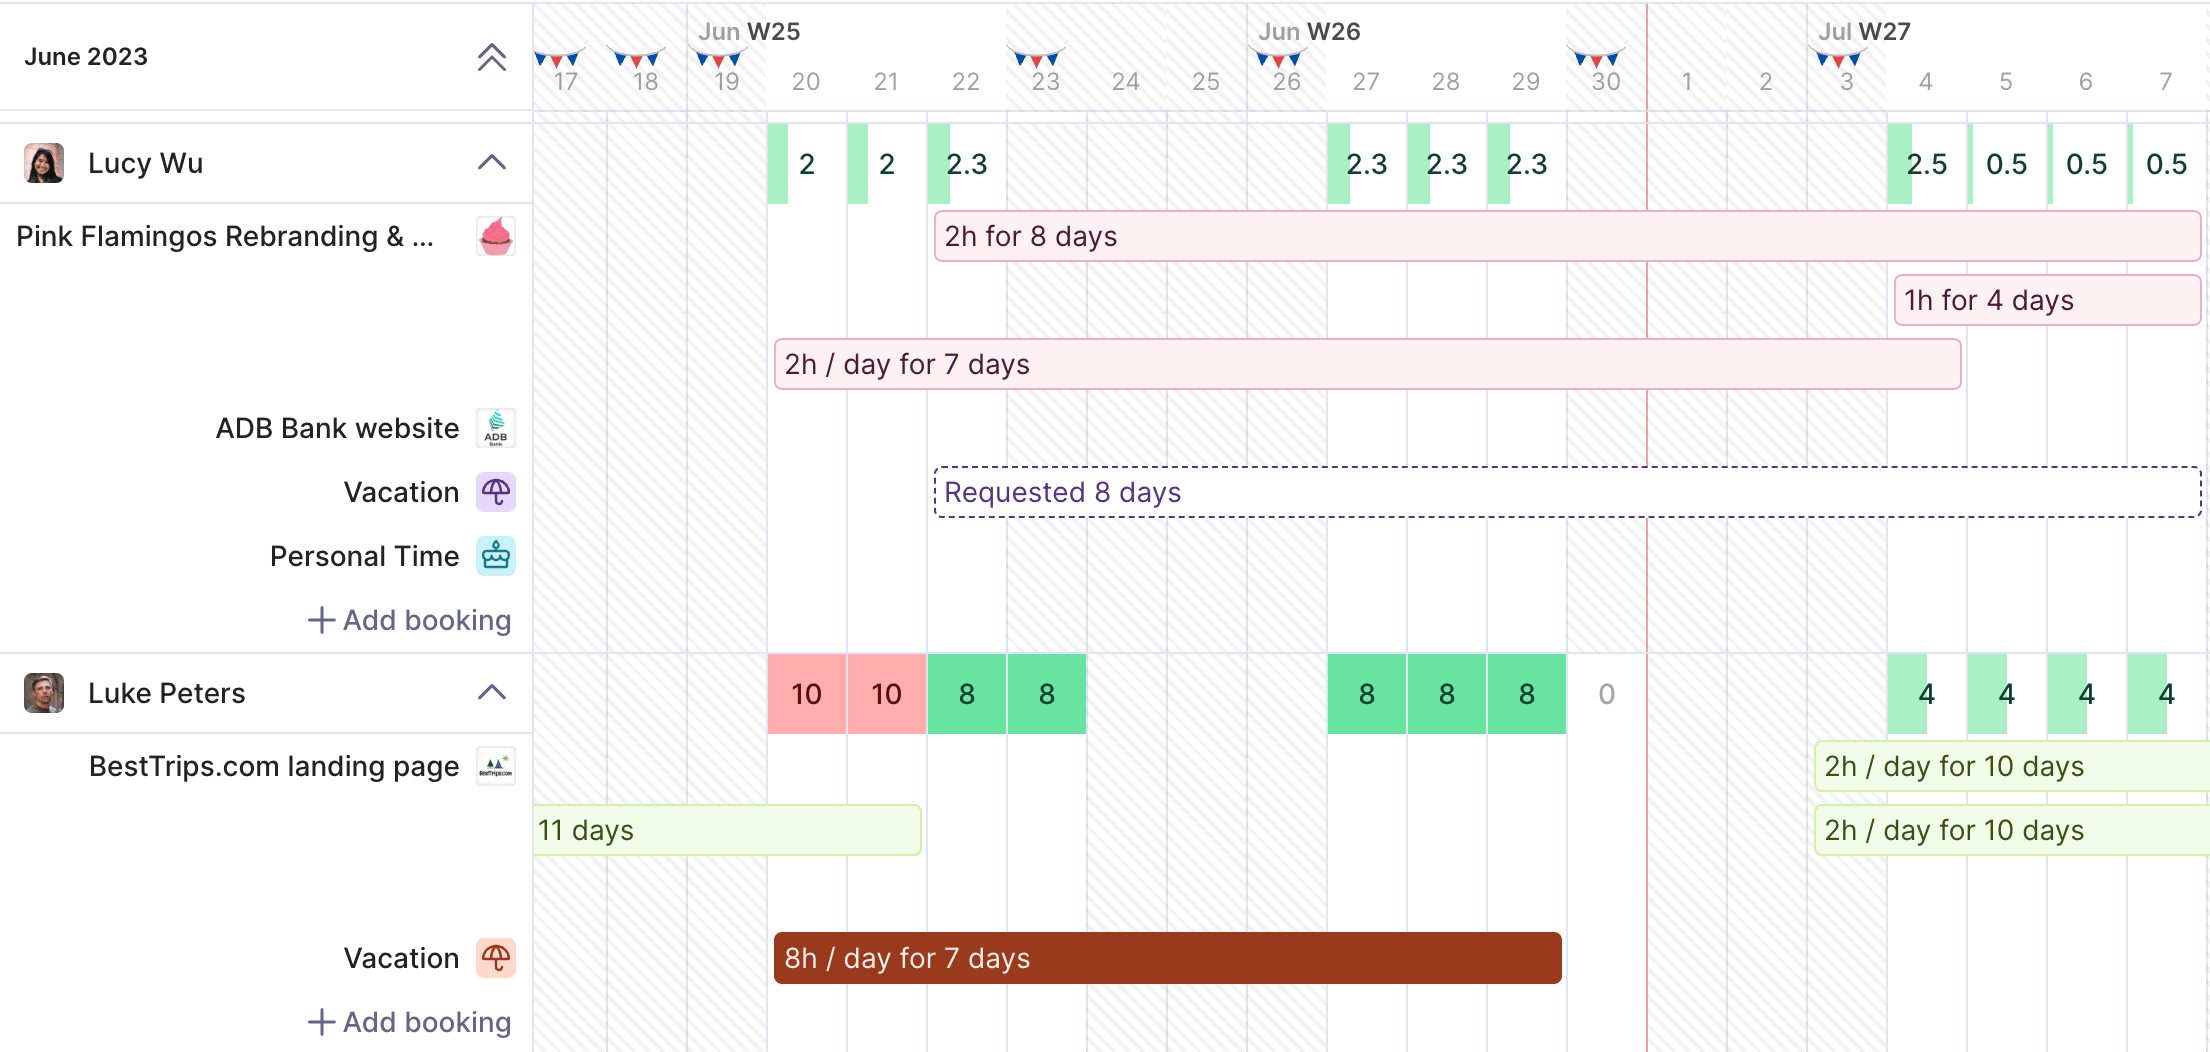
Resource Allocation and Management within a Gantt Chart
Effectively managing resources within a Gantt chart entails assigning tasks to team members, equipment, or materials in a way that optimizes productivity while avoiding overloads. Visualizing resource allocation helps identify potential conflicts or shortages early, allowing for adjustments before issues escalate. Integrating resource management within your Gantt chart makes it easier to balance workloads, prioritize assignments, and ensure that the right resources are available when needed.
Moreover, resource-aware Gantt charts turn planning into actionable management. They facilitate how to use Gantt charts effectively by providing a comprehensive view that aligns human and material capacity with project timelines. This proactive resource management reduces idle time, minimizes project delays, and enhances overall efficiency. When teams understand resource constraints visually, they are empowered to make better collaborative decisions, resulting in smoother project execution and improved outcomes.
Identifying and Managing Dependencies Between Tasks
Task dependencies are relationships that dictate the sequence in which activities must occur. Recognizing these dependencies—whether finish-to-start, start-to-start, finish-to-finish, or start-to-finish—is crucial for accurate scheduling. Incorporating dependencies into your Gantt chart transforms it from a simple timetable to a dynamic project map that reveals how tasks influence one another.
Proper management of dependencies allows you to anticipate how delays in one activity cascade through the project, enabling better risk mitigation and contingency planning. It also facilitates how to use Gantt charts effectively by highlighting critical paths—sequences of dependent tasks that directly impact project completion dates. Thorough dependency analysis ensures that project timelines are realistic, flexible, and resilient to disruptions, thus enhancing overall control and predictability.
Tracking Progress and Updating Your Gantt Chart Regularly
Continuous tracking and regular updates are vital for maintaining the accuracy and usefulness of your Gantt chart. As work progresses, discrepancies between planned schedules and actual performance become apparent, necessitating realignment of tasks, timelines, or resources. Updating the Gantt chart frequently ensures that it remains a reliable management tool that reflects current project status.
Keeping the Gantt chart current also promotes transparency and accountability among team members and stakeholders. It enables rapid identification of deviations or bottlenecks, facilitating timely corrective actions. When how to use Gantt charts effectively involves a disciplined process of updates, your team gains an adaptive project control mechanism that supports agile decision-making and keeps progress aligned with strategic objectives.
Utilizing Gantt Charts for Effective Communication and Collaboration
Gantt charts are not solely planning tools; they are powerful communication instruments that foster collaboration across diverse teams. Sharing visual timelines enhances understanding, reduces misunderstandings, and aligns stakeholders around common goals. When everyone has access to the same up-to-date Gantt chart, collaborative efforts are streamlined—decisions can be made with full awareness of task statuses and interdependencies.
Maximizing how to use Gantt charts effectively in communication involves leveraging features like real-time sharing, annotations, and progress updates. These tools foster transparency and accountability, promoting a culture of shared responsibility. Effective communication built around Gantt charts accelerates problem-solving, encourages stakeholder engagement, and creates a cohesive environment where teams work in concert towards successful project delivery.
Analyzing Gantt Chart Data to Identify Project Bottlenecks
Beyond planning and communication, Gantt charts serve as analytical ClickUP tools to identify potential project bottlenecks. Analyzing task durations, dependencies, and resource allocations reveals where delays are likely to occur or where workloads might become unmanageable. Recognizing these issues early allows project managers to adjust schedules, reallocate resources, or modify scope to keep the project on course.
Deep analysis of Gantt chart data fosters proactive problem-solving and strategic planning. It illuminates critical paths, slack times, and resource constraints, offering insights that go beyond surface-level scheduling. When used effectively, these insights help prevent crises, optimize workflow, and enhance project efficiency, turning the Gantt chart into a powerful diagnostic instrument that underpins continuous improvement.
Advanced Gantt Chart Techniques: Critical Path Method & What-If Scenarios
Advanced techniques like the Critical Path Method (CPM) deepen your ability to optimize project schedules by identifying the longest sequence of dependent tasks—the critical path—that determines the overall project duration. Focusing on these tasks allows prioritization and resource allocation where it matters most, reducing risks of delays. Incorporating CPM into your Gantt chart analysis sharpens your project management skills and leads to more accurate timelines.
Similarly, employing what-if scenario analysis within Gantt charts enables you to simulate different situations, assess potential impacts of delays or scope changes, and develop contingency plans. These techniques elevate your understanding how to use Gantt charts effectively by transforming static schedules into dynamic decision-making tools. They foster a proactive approach, helping to anticipate uncertainties and prepare strategies that safeguard project success, even amid unforeseen challenges.
Relevant Reads:
Project Management Software in 2025: An In-Depth Exploration
Tips For Effective Collaboration: Hacks for Seamless Teamwork
Conclusion
Mastering how to use Gantt charts effectively involves understanding their foundational principles, selecting suitable software, and implementing strategies to enhance project visibility, coordination, and control. By defining clear scopes and milestones, estimating realistic timelines, managing resources, and tracking progress diligently, project managers can leverage Gantt charts as integral tools for execution excellence.
Incorporating dependency management and advanced techniques like critical path analysis further refines planning, while continuous data analysis ensures proactive adjustments and risk mitigation. When integrated seamlessly into communication and collaboration processes, Gantt charts become indispensable for transforming complex projects into organized, manageable, and successful endeavors.
FAQs:
What is a Gantt chart?
A Gantt chart is a visual project management tool that shows tasks, timelines, and dependencies in a structured schedule.
Why are Gantt charts important for project management?
They improve visibility, coordination, and planning by clearly showing task progress and deadlines.
How do Gantt charts help with resource management?
They allow teams to assign resources effectively and avoid workload conflicts or delays.
What software can be used to create Gantt charts?
Tools like Microsoft Project, Smartsheet, ClickUp, and Asana support building and managing Gantt charts.
How often should a Gantt chart be updated?
It should be updated regularly to reflect actual progress and support timely decision-making.