


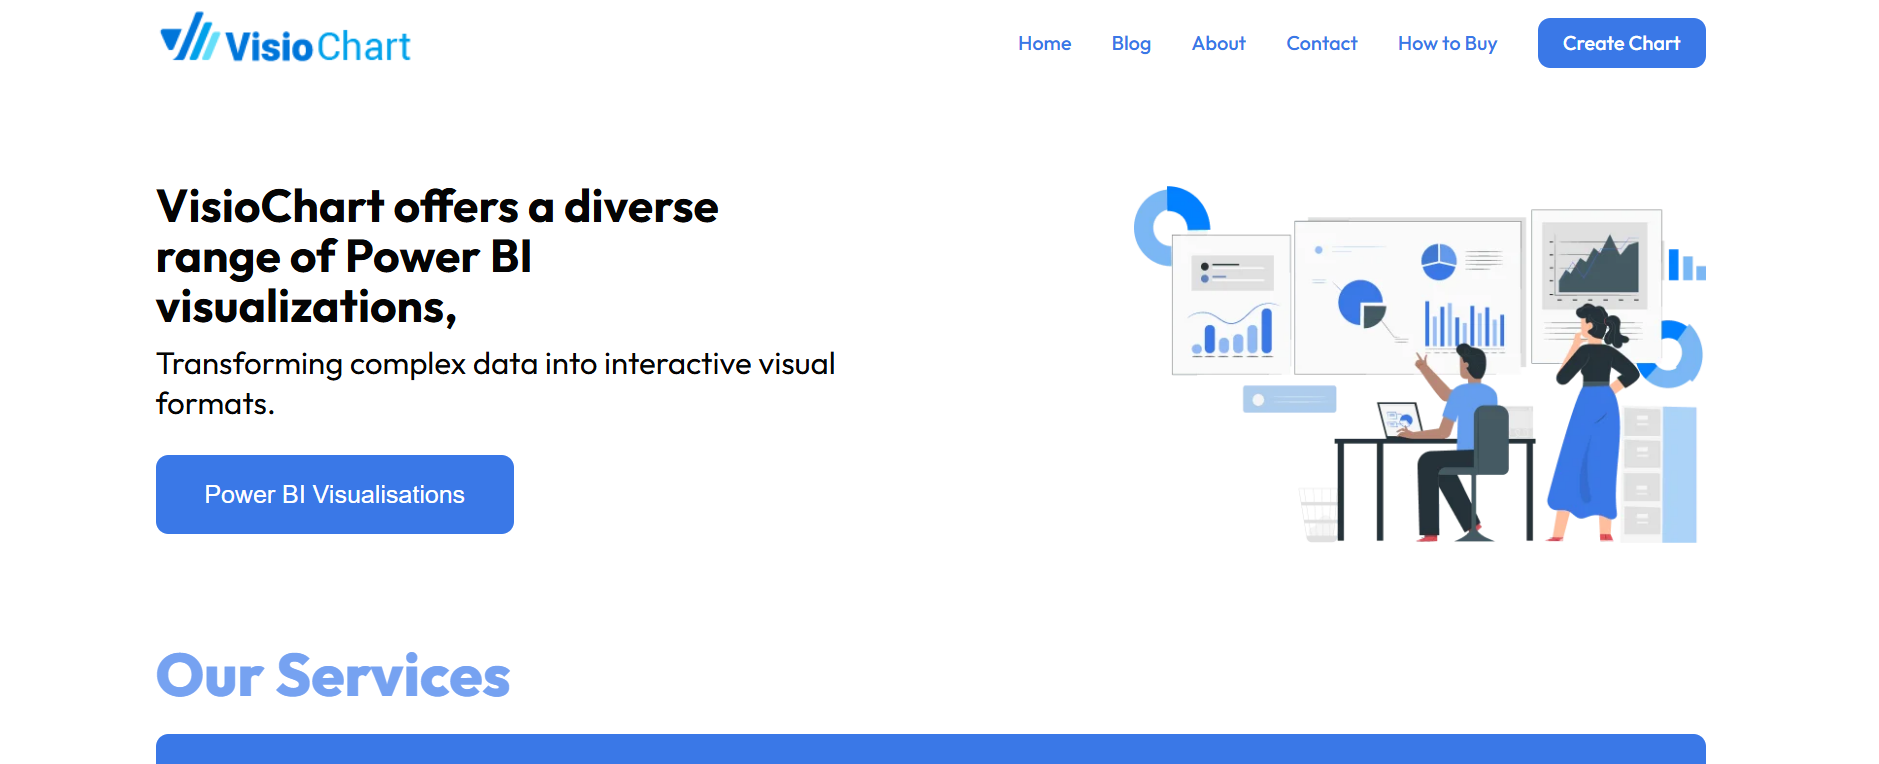
VisioChart is your go-to solution for creating stunning, interactive Power BI visualizations that turn complex data into engaging stories. Whether you’re a data analyst, business professional, or storyteller, VisioChart’s user-friendly tools make it easy to design professional charts and dashboards without any coding or design skills. Elevate your data storytelling and make your insights shine brighter than ever before.
Key Features:
-
Power BI Visualizations: Create interactive and dynamic charts for impactful data storytelling.
-
User-Friendly Interface: No coding or design expertise required—perfect for beginners and experts alike.
-
Custom Visuals: Tailor your charts to fit your unique data and narrative needs.
-
Dashboard Creation: Build professional dashboards that communicate insights clearly.
-
Energy Flow Diagrams: Visualize energy data and processes with ease.
-
Office Integration: Seamlessly integrate visuals into Microsoft Office tools.
Best for:
-
Data Analysts: Simplify complex data into interactive, easy-to-understand visuals.
-
Business Professionals: Create compelling dashboards and reports for decision-making.
-
Storytellers: Enhance your narratives with visually engaging charts.
-
Energy Sector Professionals: Visualize energy flow and processes effectively.
-
Teams Using Power BI: Elevate your Power BI projects with custom visuals.
Pricing: Please refer to the website for the most accurate and current pricing details and service offerings.
Disclaimer: Please refer to the website for the most accurate and current pricing details and service offerings.
Try now
Promote VisioChart

Write a review
 Own or work here?
Claim Now!
Claim Now!
Own or work here?
Claim Now!
Claim Now!

-
$99.00
/ Per Listing
-
Duration : Unlimited days
Lorem ipsum dolor sit amet, lorem sit.
- Verified check mark
- Indexed on Google
- FAQ Section
- Tags or keywords
- Free newsletter feature
- Published within 2 days
- Long texts and media
- Social Links
- Lead Form
- Announcement Feature
- Deals/Offers/Discounts Feature
-
$49.00
/ Per Listing
-
Duration : Unlimited days
Lorem ipsum dolor sit amet, lorem sit.
- Verified check mark
- Indexed on Google
- FAQ Section
- Tags or Keywords
- Free newsletter feature
- Published within 4 days
Claim request is processed after verification..
Featured AI Tools
-
Leadsin io
Leadsin.io – The Ultimate LinkedIn Automation ToolLeadsin.io is a powerful…
-
-
TRADLINX Ocean Visibility
TRADLINX Ocean Visibility provides real-time shipment tracking, advanced data insights,…
-
Datapad
Datapad.io is an AI-powered data assistant that simplifies business analytics…
-
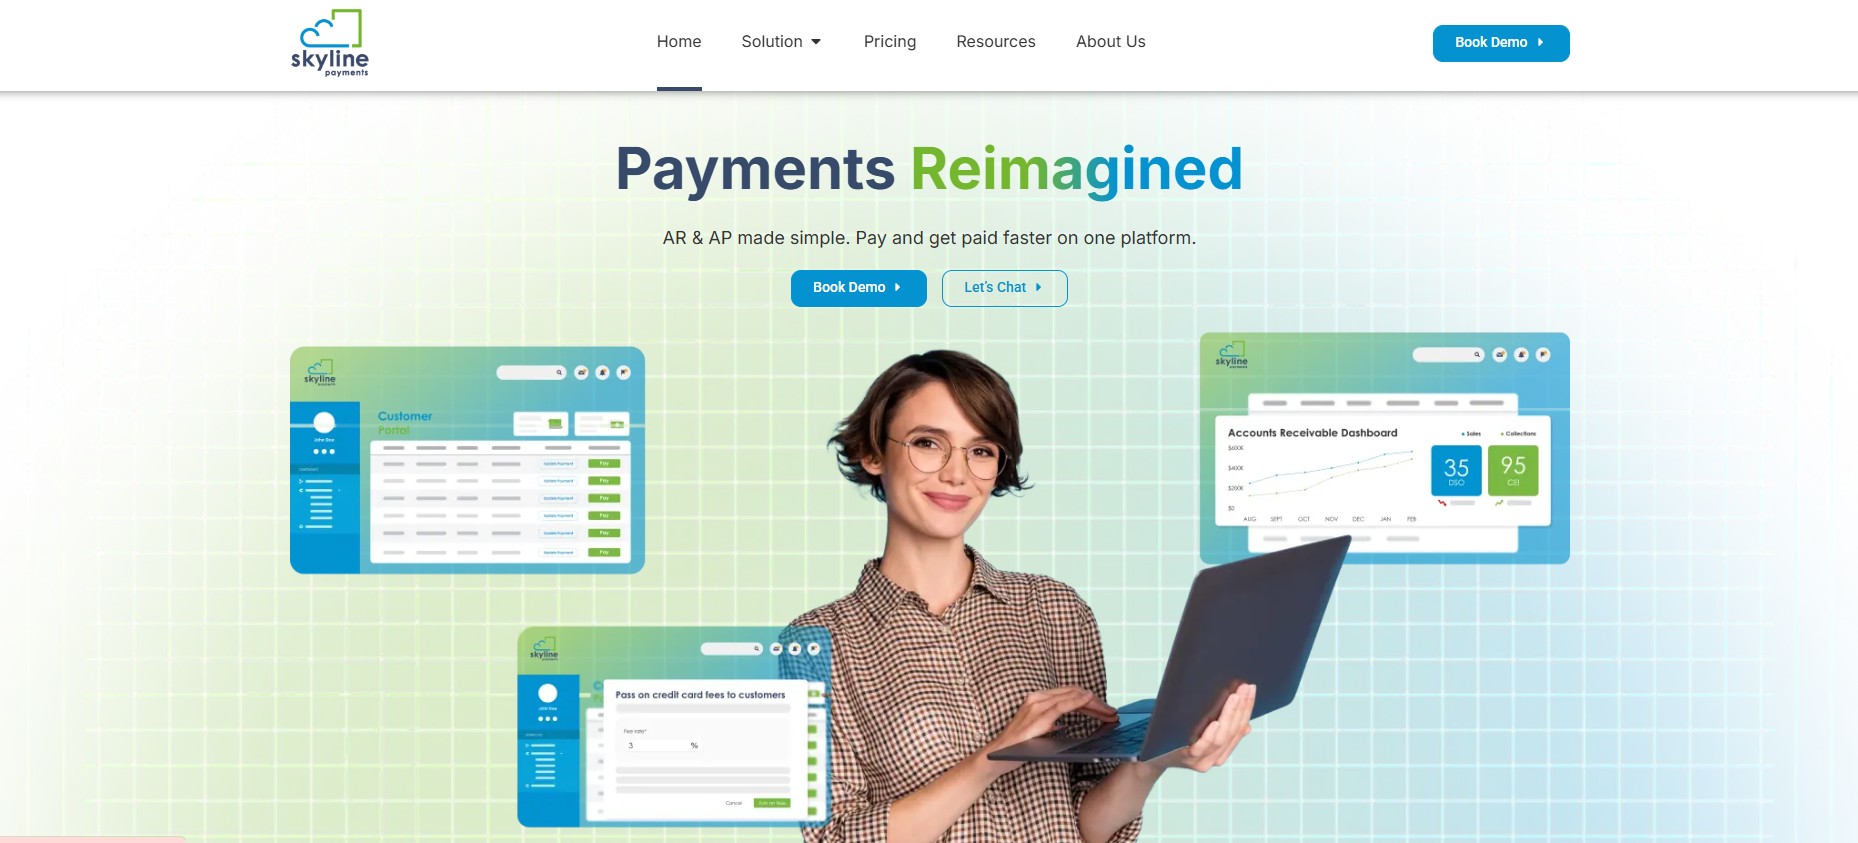
Skyline Payments
Skyline Payments streamlines accounts receivable and payable, helping businesses get…
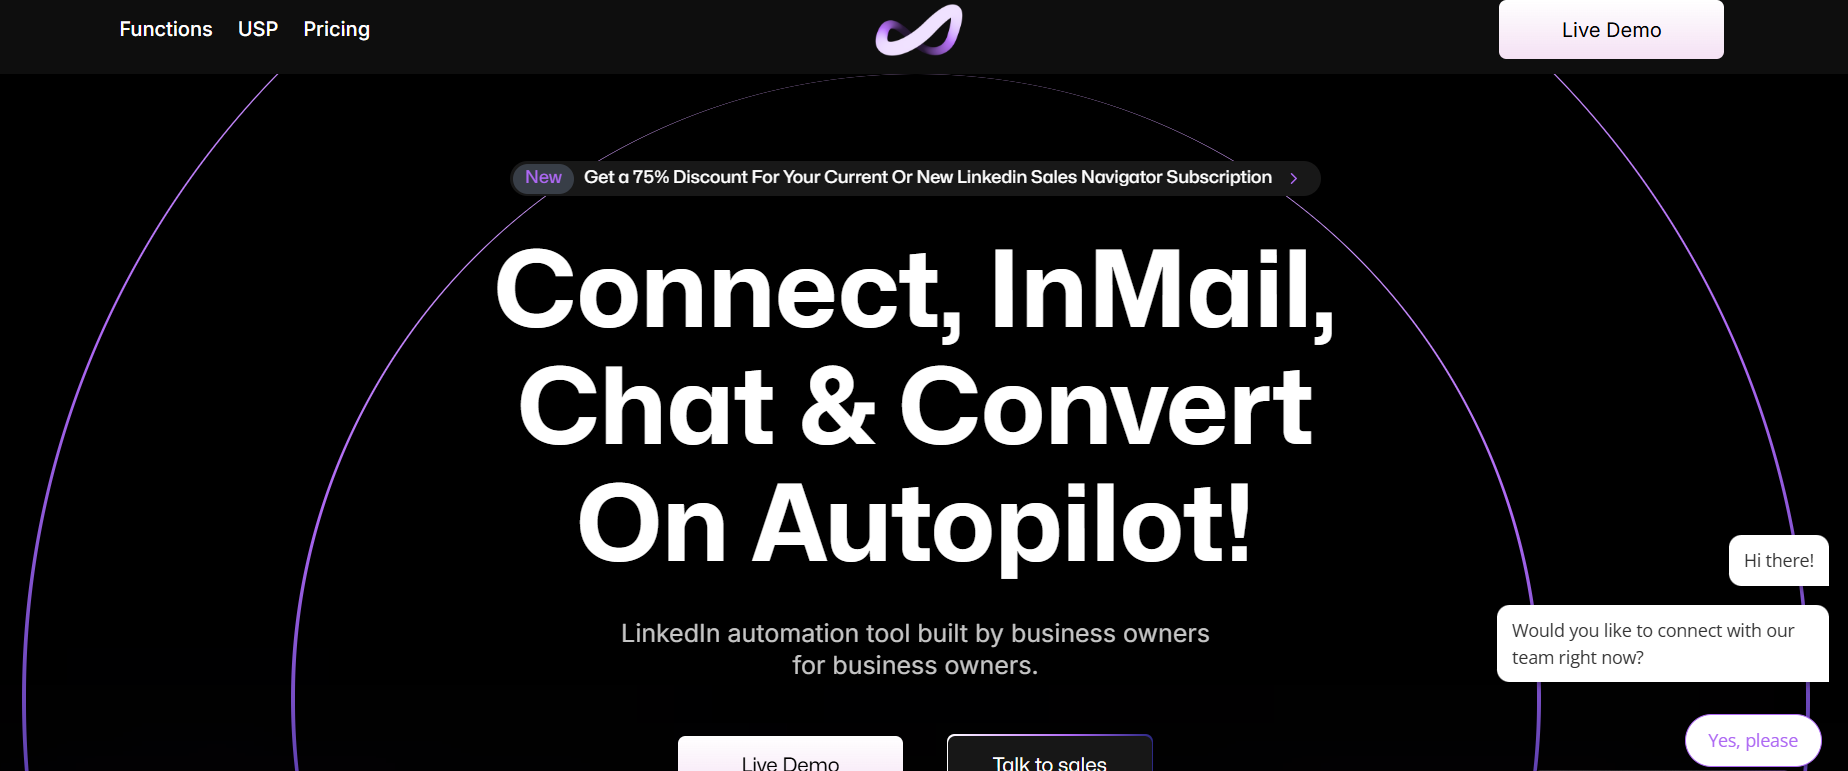
Leadsin io
Leadsin.io – The Ultimate LinkedIn Automation ToolLeadsin.io is a powerful…

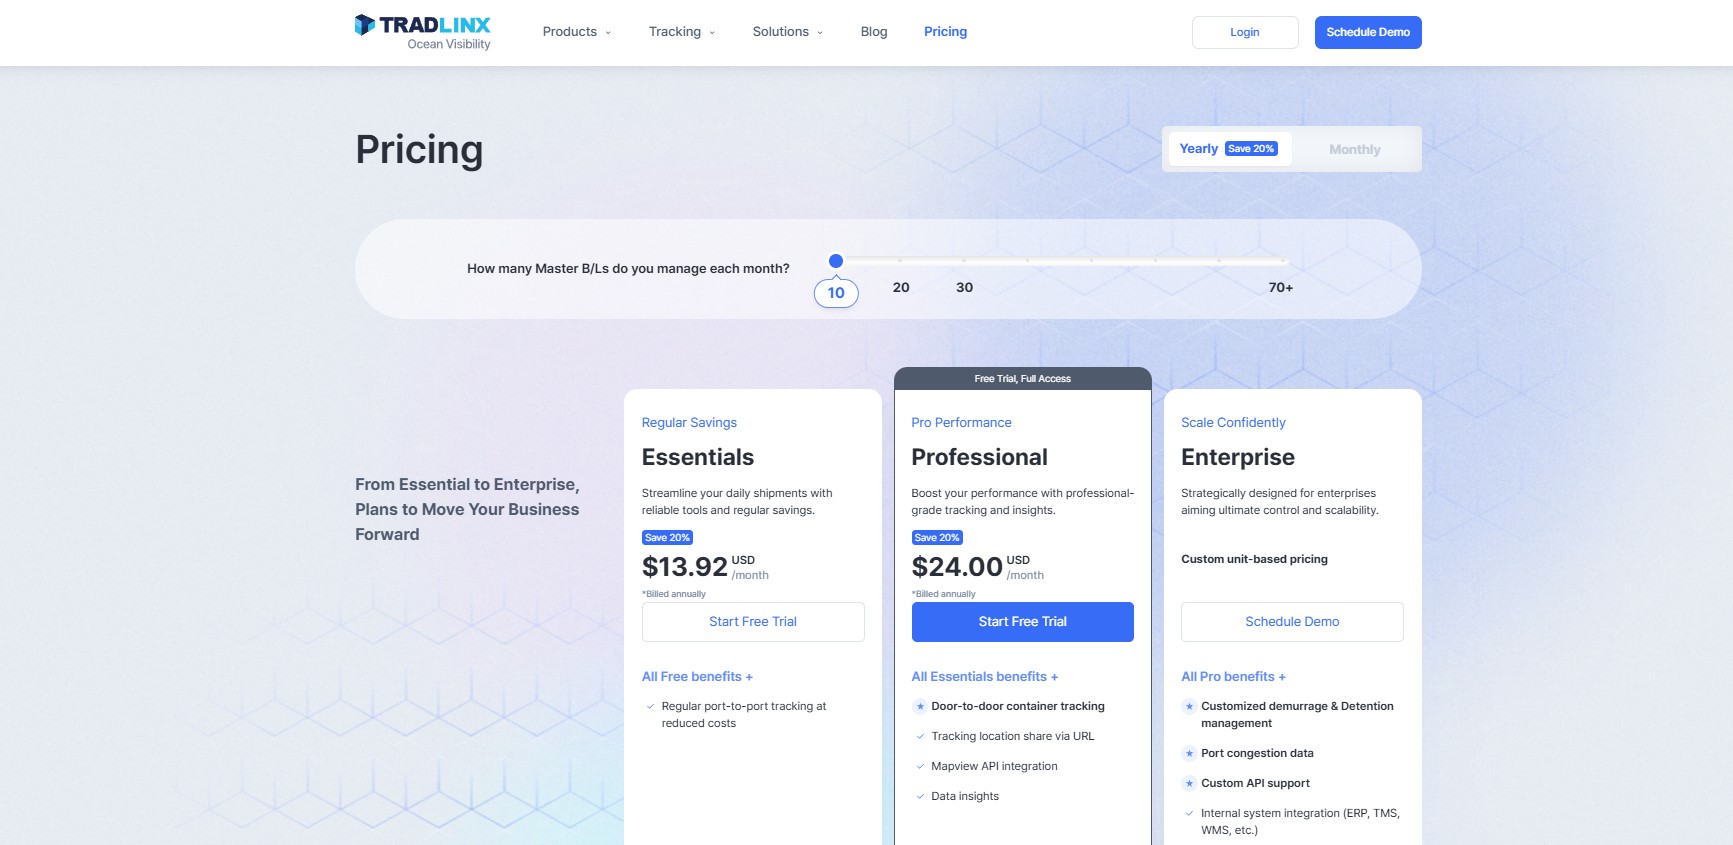
TRADLINX Ocean Visibility
TRADLINX Ocean Visibility provides real-time shipment tracking, advanced data insights,…
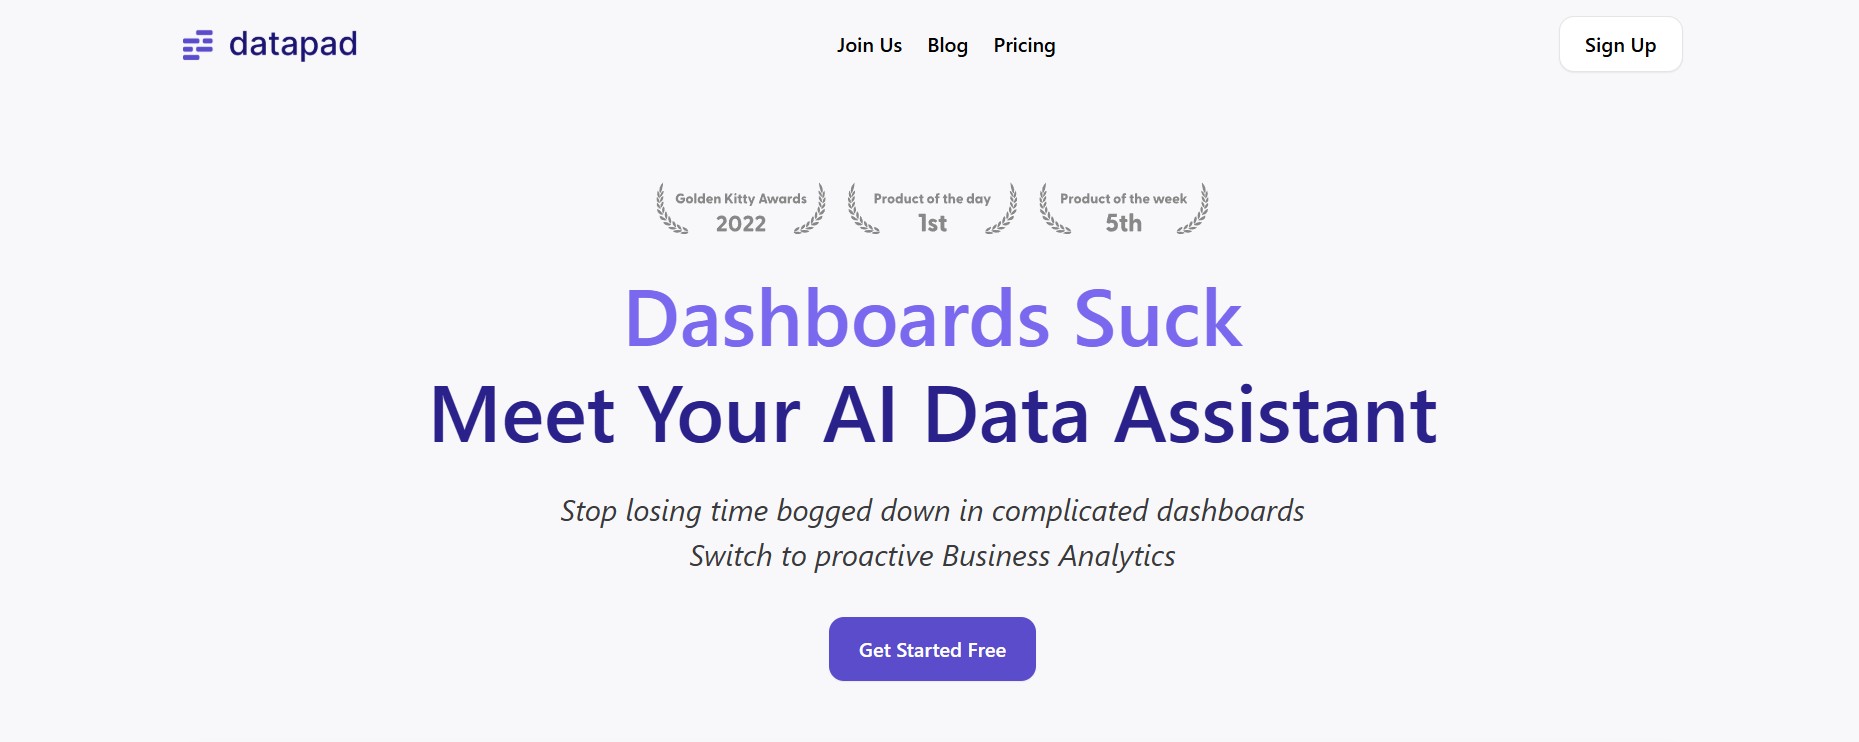
Datapad
Datapad.io is an AI-powered data assistant that simplifies business analytics…
Skyline Payments
Skyline Payments streamlines accounts receivable and payable, helping businesses get…
